ImageBench

The only generative image benchmark that shows the images

17 models, 192 prompts, 6 categories — every output published. Judge with your own eyes which model is best for your use case, your budget, your quality bar.
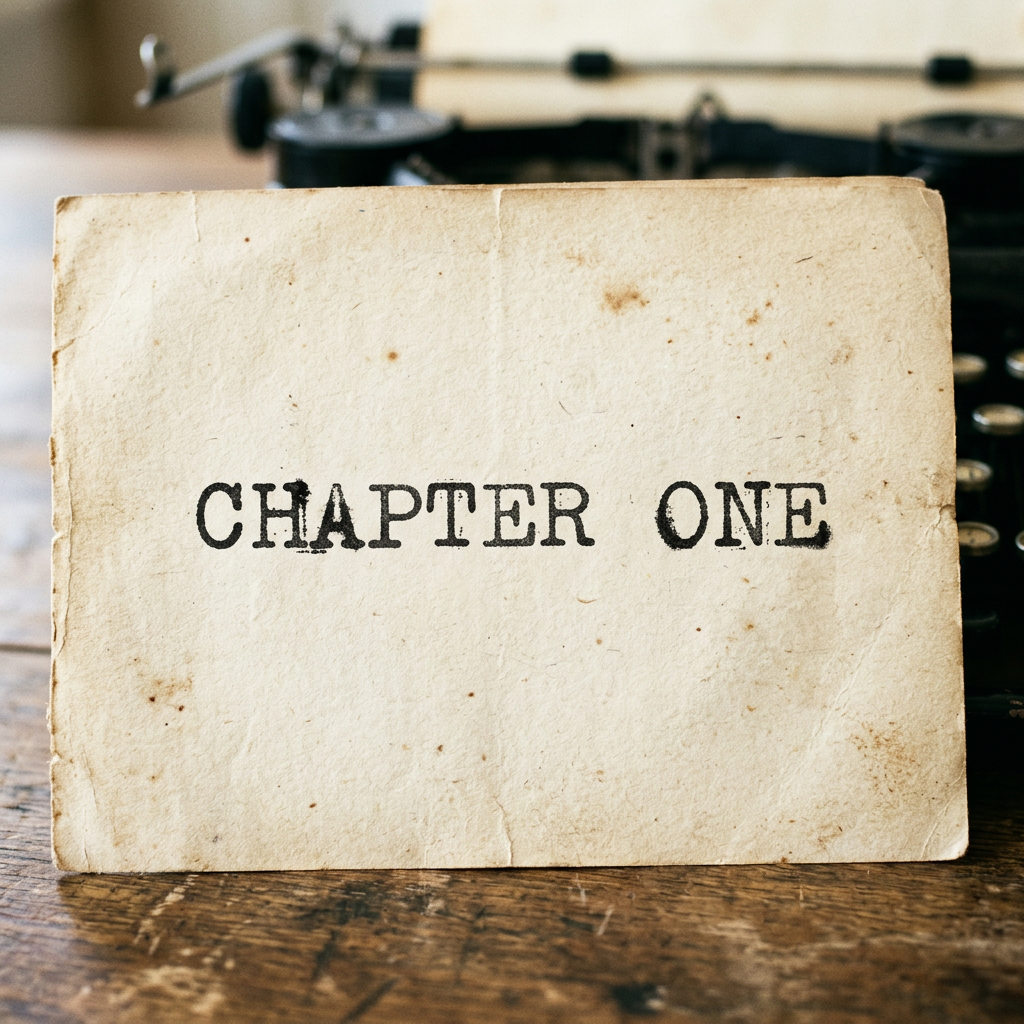
V1 Leaderboard

192 prompts, 6 categories, graded pass/fail by VLM judges.

#ModelPass RatePass / FailAvg Latency
1fal/google/nano-banana-2
95.3%
183/928.1s
2openai/gpt-image-2
95.3%
183/945.3s
3fal/google/nano-banana-pro
91.1%
175/1723.4s
4bfl/flux-2-max
90.6%
174/1826.7s
5fal/bytedance/seedream-v4
84.4%
162/3014.1s
6bfl/flux-2-pro
82.8%
159/3311.8s
7fal/ideogram/v4
82.3%
158/3416.6s
8bfl/flux-2-klein-9b
78.6%
151/414.1s
9local/z-image-6b
75.5%
145/47130.7s
10local/z-image-turbo-6b
74.5%
143/4918.1s
11bfl/flux-2-klein-4b
72.4%
139/533.8s
12local/qwen-image-2512-20b
69.3%
133/5980.2s
13local/bonsai-image-ternary-4b
68.2%
131/614.1s
14fal/ideogram/v3
68.2%
131/6112.9s
15local/nucleus-image-17b-a2b
64.1%
123/6939.1s
16local/hidream-i1-full-17b
56.8%
109/8391.3s
17local/sana-1.5-1.6b
51.0%
98/9411.1s

What we evaluate

Each model is tested across 6 categories with 192 prompts spanning easy to extreme difficulty.

Text Rendering
Typography accuracy, writing correctness across difficulty levels
Spatial Reasoning
Compositionality, counting, relative position, scale & proportions
Human Realism
Faces, expressions, hands, full body, multi-subject coherence
Truthfulness
Physics, reflections, photorealism, world knowledge
Professional Studio
Camera & lighting, color precision, photorealistic quality
Graphical Design
Layout, data visualisation, style diversity

Frequently asked questions

See how every model performs

Compare models side-by-side with our interactive benchmark explorer.

Explore ImageBench V1